


Assessing Bitcoin’s Market as It Secures Position Above $37K
As the start of a new trading week commences, the cryptocurrency titan Bitcoin (BTC) maintains its stance just over the $37,000 mark. Observing the 24-hour span, the price experienced a swing between the lows of $36,441 and the peaks of $37,516 per coin, accompanying these shifts is a considerable $15.55 billion in worldwide transactions.
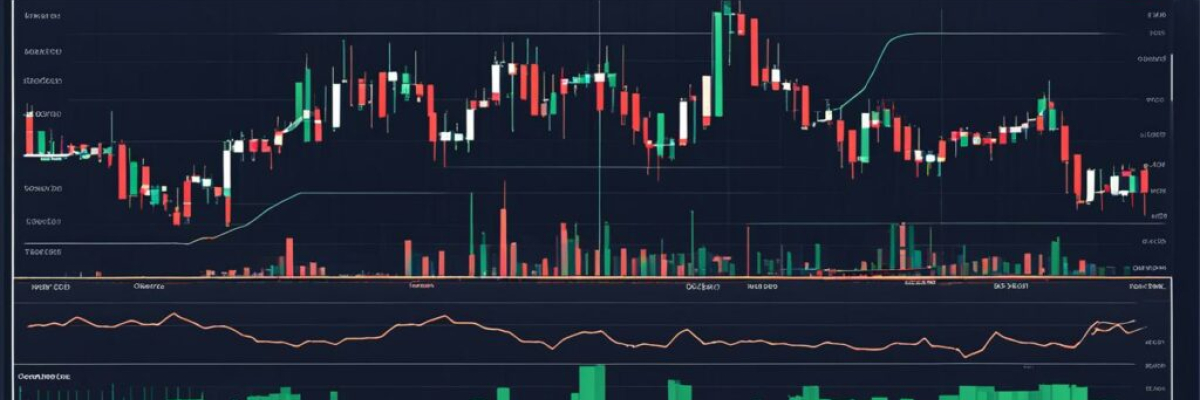
An in-depth look into bitcoin’s current market status unveils a cautiously optimistic narrative, bolstered by critical analysis drawn from popular technical indicators such as the relative strength index (RSI), the stochastic oscillator, and the commodity channel index (CCI), along with crucial insights from various moving averages.
On this day, the RSI for bitcoin reads at 63, suggesting a market in balance. This equilibrium within the trading landscape indicates that bitcoin is neither overbought nor oversold, presenting an equally weighted arena for potential price movements in either direction. Astute investors tend to monitor RSI metrics diligently, noting that a spike past 70 could imply a tendency towards overbuying, and a drop below 30 might herald an oversold market scenario.
The Stochastic oscillator also casts a stance of neutrality with its reading hovering at 74. Edging closer to the top end of its range, it proposes the likelihood of bitcoin being perceived as somewhat overvalued. Nevertheless, it doesn’t preclude the chance for further price advances. However, traders should remain vigilant for consistent numbers above 80 which could signal a market peak and a potential downtrend ahead, especially if bitcoin is seen as overpriced or market sentiment overheats.
Touching on the CCI, we find it stationed at 88, nearing the threshold of an overbought market without actually breaching it. Should the CCI travel beyond +100, it would traditionally be read as overbought; inversely, a figure lower than -100 would indicate an oversold market. Meanwhile, the trend painted by the exponential and simple moving averages (EMAs and SMAs) across different timelines delineates a predominantly bullish market tendency.
When considering the 10-day EMA and SMA—respectively pinpointed at $36,715 and $36,814—they project a bullish stance in the near term. Extending to longer periods, the 200-day EMA and SMA which lie at $29,293 and $29,006, affirm the strength of the uptrend by resting well below the current prices. The ongoing short-term trend, while asserting a bullish bias, is seen as somewhat erratic, thereby hinting at potential bumps in market stability over the forthcoming period.
A Positive Outlook for Bitcoin:
Scrutinizing Bitcoin’s technical analysis at this junction lends some gravity to the bullish camp. The indicators provide a tale of pending advancement, depicting a cryptosphere that’s tilting slightly towards a bullish climb with key metrics like the neutral-leaning RSI, a stochastic value proposing growth potential, and a CCI that’s flirting with overbought conditions.
The Conservative Standpoint:
On the flip side of the bullish enthusiasm, there’s a thread of caution interwoven into Bitcoin’s future market projections. The proximity of both the RSI and the stochastic oscillator’s readings to their respective upper extremes could be precursors to market saturation, which might kickstart a trend reversal. The CCI’s dalliance with the overbought margin further magnifies the need for caution among market participants.
What are your perspectives on Bitcoin’s latest market movements as the week gets underway? Engage in the conversation below by sharing your insights and points of view on this topic.

Frequently asked Questions
1. How has Bitcoin managed to maintain its balance above $37K amidst market uncertainty?
Answer: Bitcoin has maintained its balance above $37K amidst market uncertainty primarily due to strong support at this price level from both retail and institutional investors. Additionally, the limited supply of Bitcoin, coupled with increasing adoption and interest from major financial players, has contributed to its resilience during uncertain market conditions.
2. What is Bitcoin technical analysis and how does it help in understanding market trends?
Answer: Bitcoin technical analysis is a method of evaluating the price movement and patterns of Bitcoin using historical data and statistical indicators. It helps traders and investors identify trends, support and resistance levels, and potential price targets. By analyzing charts, patterns, and various technical indicators, individuals can make informed decisions about buying or selling Bitcoin based on the predicted market trends.
3. Are there any specific technical indicators that are commonly used in Bitcoin technical analysis?
Answer: Yes, there are several technical indicators commonly used in Bitcoin technical analysis. Some of the popular ones include moving averages, relative strength index (RSI), Bollinger Bands, MACD (Moving Average Convergence Divergence), and Fibonacci retracement levels. Traders and analysts often combine these indicators to gain a deeper understanding of Bitcoin’s price movement and to generate trading signals.
4. How does market uncertainty affect Bitcoin’s technical analysis?
Answer: Market uncertainty can significantly impact Bitcoin’s technical analysis as it may lead to increased volatility and unpredictable price movements. During periods of uncertainty, technical indicators may lose their reliability, and traditional patterns and trends may not hold. Traders and analysts need to adapt their strategies and closely monitor market sentiment and news events to incorporate fundamental analysis alongside technical analysis when assessing Bitcoin’s behavior.
5. What role do support and resistance levels play in Bitcoin technical analysis?
Answer: Support and resistance levels are key elements in Bitcoin technical analysis. Support levels are price levels at which Bitcoin tends to find buying interest, preventing it from falling further. Resistance levels, on the other hand, are price levels at which Bitcoin tends to face selling pressure, preventing it from rising further. These levels help traders identify potential entry and exit points, as well as determine the strength of market trends.
6. How can Bitcoin technical analysis assist in making trading decisions?
Answer: Bitcoin technical analysis assists in making trading decisions by providing insights into potential price movements, trend reversals, and key levels to watch. Traders can use technical analysis to identify optimal entry and exit points, set stop-loss and take-profit levels, and manage risk effectively. However, it is important to combine technical analysis with other factors such as market sentiment and fundamental analysis for a comprehensive understanding of the market.
7. Can Bitcoin technical analysis accurately predict future price movements?
Answer: Bitcoin technical analysis provides insights into potential price movements, but it is not a foolproof method to accurately predict the future. Price movements in the cryptocurrency market are influenced by various factors, including market sentiment, news events, regulatory developments, and global economic conditions. While technical analysis can help identify patterns and trends, it is essential to consider other factors and exercise caution when making trading decisions based solely on technical indicators.


