


A Deep Dive into Bitcoin’s Stability and Growth Potential
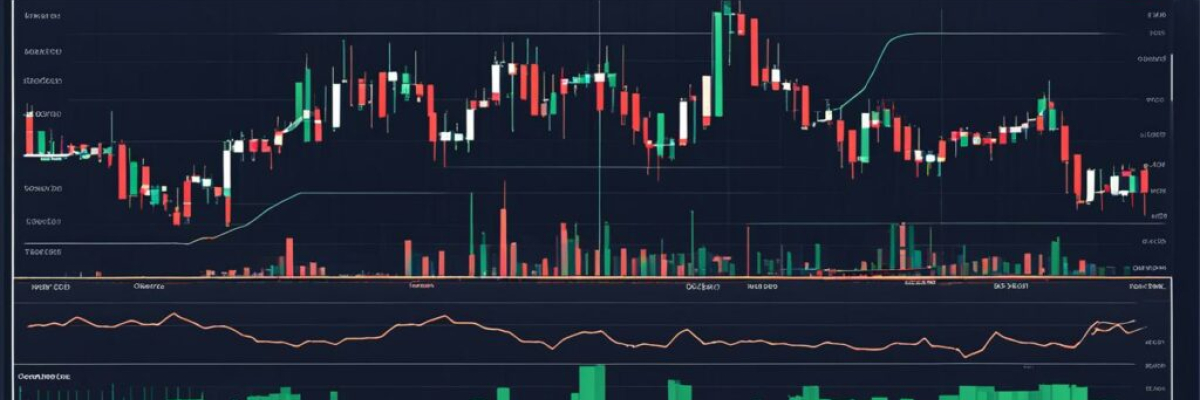
The world’s most popular cryptocurrency, Bitcoin, sees its value holding steady around the $35,140 mark, exhibiting only slight shifts in its 24-hour trading cycle. Notwithstanding the recent fluctuations, investors are somewhat positive, as forecasted through vital technical barometers. Current readings of the RSI and Stochastic oscillators are neutral, while bullish indicators from moving averages signal prospective positive momentum.
Bitcoin’s Market Presence
In contrast to the mixed signals emanating from the stock markets of the U.S., Bitcoin has successfully maintained its footing above the $35K mark this Monday. The digital asset commands a strong position in the market with its market cap stabilizing at $686 billion and a trading volume of $13.72 billion over the preceding 24 hours. Bitcoin’s presence is undoubtedly robust in today’s financial landscape.
Bitcoin’s relative strength index (RSI) stands strong at 77, which is often associated with the asset being overbought. However, contemporary market interpretations label this indicator as neutral. This neutrality suggests that traders are not overexerting in either direction, maintaining a balance between bullish and bearish sentiment.
Bitcoin’s Moving Averages
On the shorter-term side, Bitcoin’s moving averages are trending positively. Both the 10-day exponential moving average (EMA) and the simple moving average (SMA) are placed above the recent price, recorded at $34,571 and $34,821 correspondingly. Such positioning typically spurs a bullish sentiment among investors, as it indicates a continued upward trend. When inspected in light of the 20-day EMA valued at $33,263, which lies notably below the current market price, the positive outlook is further solidified.
The significant gap between the EMA and the current price underlines a powerful upward trend over an extended period, potentially pulling in swing traders and investors hoping for confirmation of the bullish trend. The commodity channel index (CCI) is currently at 65, a figure within the normal range. This avoids extremes and suggests that conditions are neither overbought nor oversold.
We always encourage your feedback. Please feel free to share your thoughts and opinions on Bitcoin’s performance this Monday in the comment section below.
PLEASE NOTE: This article provides a brief overview of Bitcoin’s market status and potential, it is imperative to conduct personal research before undertaking any investment.

Frequently asked Questions
1. What is Bitcoin technical analysis?
Bitcoin technical analysis is a method used by traders and investors to forecast future price movements of Bitcoin based on historical price data, chart patterns, and various technical indicators. It involves analyzing statistics and market trends to make informed decisions about buying, selling, or holding Bitcoin.
2. How does Bitcoin staying strong over $35K indicate growth potential?
When Bitcoin maintains a strong position above $35,000, it signals that there is a significant level of support and demand at that price level. This suggests that market participants are confident in Bitcoin’s value and are willing to buy it at that price. Such resilience often indicates a positive market sentiment and can be seen as a bullish sign, pointing to the potential for further growth in the future.
3. What are some signs of growth potential in Bitcoin’s technical analysis?
Several signs in Bitcoin’s technical analysis can indicate growth potential. These include:
– Breakouts from key resistance levels.
– Bullish chart patterns like ascending triangles or cup and handle formations.
– Increasing trading volume, indicating heightened market activity.
– Positive divergence between price and technical indicators.
– Bullish crossovers on moving averages.
– Bullish reversal candlestick patterns such as hammer or morning star patterns.
– Positive developments in fundamental factors, such as increased adoption or regulatory support for cryptocurrencies.
4. How reliable is Bitcoin technical analysis in predicting price movements?
Bitcoin technical analysis provides valuable insights into price trends and market sentiment, but it is important to note that it is not foolproof. While historical price data and technical indicators can offer guidance, they cannot guarantee accurate predictions of future price movements. Market dynamics, external factors, and unexpected events can influence Bitcoin’s price in ways that technical analysis alone may not capture. Therefore, it is crucial to consider other factors and conduct thorough research before making investment decisions.
5. Are there any risks associated with relying solely on Bitcoin technical analysis?
Relying solely on Bitcoin technical analysis can present certain risks. Market sentiment and price trends can change rapidly, and technical analysis might not always provide a complete picture of the market. Ignoring fundamental factors, such as news events or regulatory changes, can lead to missed opportunities or unexpected losses. It is advisable to use technical analysis as part of a comprehensive investment strategy that incorporates fundamental analysis and risk management techniques.
6. Can Bitcoin technical analysis be used for short-term trading?
Yes, Bitcoin technical analysis can be used for short-term trading. Traders often employ various technical indicators, candlestick patterns, and chart patterns to identify short-term price movements and take advantage of potential profit opportunities. However, it is important to note that short-term trading carries its own risks, including increased market volatility and the need for precise timing. Traders should use risk management strategies and stay updated with market trends to make well-informed decisions.
7. How can beginners learn Bitcoin technical analysis?
Beginners can start learning Bitcoin technical analysis by studying educational resources, such as books, online articles, and video tutorials, that explain the basics of technical analysis. It is essential to understand key concepts like support and resistance levels, trendlines, moving averages, and popular technical indicators. Additionally, practicing on demo trading platforms can help beginners gain hands-on experience in applying technical analysis tools and interpreting price charts. Seeking guidance from experienced traders or joining online communities can also provide valuable insights and learning opportunities.


