


Bitcoin Maintains Stability Above $35,000 Despite Reduction in Momentum
Even though the momentum has experienced a decrease in the past week, Bitcoin’s current price continues to stabilize over the $35,000 mark. Bitcoin, being the world’s premier digital asset by market capitalization, had its closing price at $35,369 on November 8.
Bitcoin Holds its Ground Over $35,000 as Global Markets Display Varied Signals
The global markets experienced a variable trend on Wednesday, November 8, 2023. The eyes of investors across the globe are directed towards Jerome Powell, the U.S. Federal Reserve chairman, who is expected to make a statement today. In this situation of deliberation, traders around the world are trying to predict the strength of central bankers’ strategy against the recent decrease in Treasury bond yields. On the other hand, cryptocurrency markets are holding firm, with Bitcoin (BTC) consistent over the $35,000.
The Technical Picture for Bitcoin
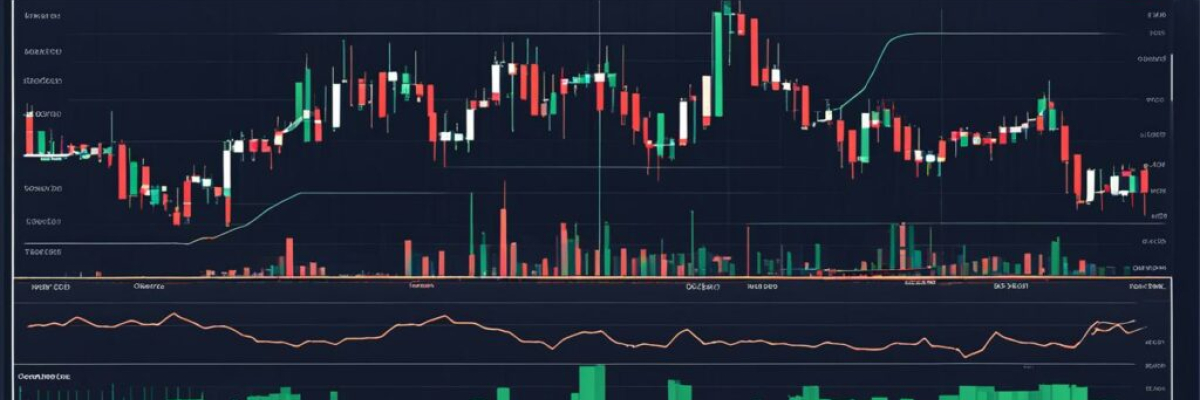
The current position of RSI (Relative Strength Index), a momentum oscillator that measures price movements’ speed and change, is 77, indicating an overbought territory. This hints at a possible downward pressure on BTC’s price in the near future. The Stochastic oscillator’s reading of 75 adds weight to the suggestion of overbought levels. Meanwhile, with a score of 76, the Commodity Channel Index (CCI) reflects the upward price trend that took place recently.
Bitcoin’s moving averages revel in both short and long term bullishness. The present value of the 50-day exponential moving average (EMA) is $31,113, whereas the 50-day simple moving average (SMA) is sitting at $29,927. With prices securely above these averages, Bitcoin’s trading situation appears well-anchored over these mid-term resistance points and averages.
Noticable supporting levels are also offered by the long-term moving averages, with the 200-day exponential moving average sitting at $28,327 and the 200-day simple moving average at $28,512. Bitcoin’s performance over these levels signifies sustained interest from buyers during the last seven days. However, the overbought readings from momentum oscillators hint that consolidation or a slight pullback might take place before BTC can rise again.
Despite the ongoing positive projection of Bitcoin’s technical state, the situation seems ripe for a brief halt or minor ammendment following the previous rally. As long as Bitcoin continues to maintain the price above the key $30,000 support level, the long-term upward trend can be said to remain intact. However, any dip below $30,000 could result in the reestablishment of the defensive stance by the bulls.
What is your perspective about today’s Bitcoin price movement? Share your thoughts and opinions about this subject in the comments section below.

Frequently asked Questions
1. What is Bitcoin technical analysis?
Bitcoin technical analysis is a method used by traders and investors to study historical price data, charts, and indicators to predict future price movements of Bitcoin. It involves analyzing patterns, trends, and market sentiment to make informed decisions.
2. How does Bitcoin’s price currently stand?
As of now, Bitcoin’s price is holding strong above $35,000. Despite some signs of slowing momentum, it has managed to stay above this crucial level, indicating resilience and potential for further upward movement.
3. Why is $35,000 considered an important level for Bitcoin’s price?
$35,000 is considered a significant level for Bitcoin’s price because it has acted as both support and resistance in the past. If Bitcoin continues to stay above this level, it suggests a bullish sentiment in the market, potentially attracting more buyers.
4. What does “slowing momentum” mean in Bitcoin technical analysis?
“Slowing momentum” refers to a decrease in the rate at which Bitcoin’s price is increasing or decreasing. It indicates that the market may be losing its strength or enthusiasm, potentially leading to a consolidation or a period of sideways movement in the price.
5. How does technical analysis help in understanding Bitcoin’s price movement?
Technical analysis helps in understanding Bitcoin’s price movement by providing insights into the psychology and behavior of market participants. It helps identify key levels of support and resistance, patterns, and trends, which can be used to anticipate potential price reversals or continuations.
6. What factors can influence Bitcoin’s slowing momentum?
Several factors can influence Bitcoin’s slowing momentum, such as profit-taking by traders, increased regulatory scrutiny, market saturation, or a decrease in overall market interest. Additionally, macroeconomic events, geopolitical tensions, or major news developments can also impact the momentum of Bitcoin’s price.
7. Should investors be concerned about Bitcoin’s slowing momentum?
While slowing momentum may raise concerns for some investors, it is important to consider the broader context and other indicators before drawing conclusions. Bitcoin’s price has historically experienced periods of consolidation and sideways movement before resuming its upward trend. Investors should assess multiple factors and consult professional advice before making investment decisions.


