


Market Pulse: Bitcoin’s Current Stance
The landscape of the cryptocurrency market witnessed a slight downturn recently, with an overall drop exceeding 2%. Within this greater context, Bitcoin experienced a subtle decline of 2% in its valuation against the dollar over the past day. Moreover, there’s been a 3.4% decrease from its recent spike to $38,437 on November 25.
As we stepped into November 27, 2023, Bitcoin’s valuation settled at approximately $36,951, a figure that reflects its 24-hour fluctuation between $36,899 and $37,748. The market cap of this leading cryptocurrency hovered around the $725 billion mark, supported by the trading volume reaching $16.79 billion.
Vital Signs: Oscillators and Moving Averages
Diving into the vital statistics, oscillators culminate in a mixed signal as to where Bitcoin’s momentum stands. For instance, the relative strength index (RSI), positioned at 57, conveys a stance between neutral and a hint of bearishness, as it steers clear from extremes of overbought or oversold territories. Along similar lines, Stochastic readings at 71 and the commodity channel index (CCI) at 51 both consolidate around a neutral mood – suggesting a market equilibrium.
Contrastingly, moving averages paint a distinct picture spanning various time frames. Short-tenure markers like the 10-day exponential moving average (EMA) and simple moving average (SMA) exude a bearish tone. But, extending our gaze to the 20-200 day ranges, the indicators transit gradually from a neutral zone to a bullish signal. This mixed messaging implies a near-term guardedness amidst a foundation of underlying long-term optimism.
Charting the Course: Daily and Four-Hour Perspectives
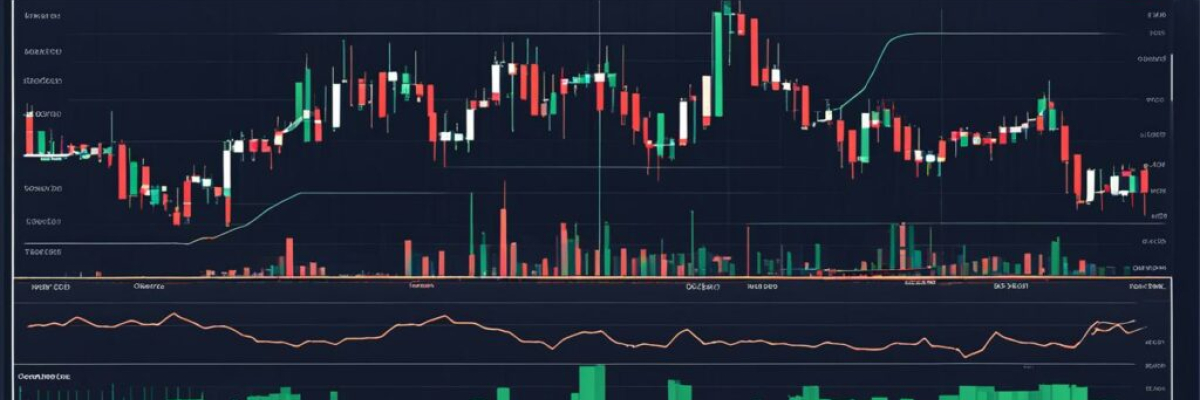
An assessment of the daily charts positions Bitcoin within a bullish narrative initiated in the early days of October, backed by a pattern of escalating lows and highs. Despite the evident volatility, as highlighted by the pronounced candle wicks, the market has held its ground. A firm support level presents itself in the vicinity of $33,000, challenging resistance around the peak of $38,437 observed two days back. Nevertheless, wavering trading volumes introduce a degree of unpredictability into prospective trading sessions.
Taking a closer examination through the four-hour charts, we witness a nascent bearish trend marked by descending highs and lows post peak. Prevailing bearish candle formations propose that this downward trend might have some room to run, with the next substantial support pitched around $35,651 and resistance resting at the recent peak. Notable is the subdued trading activity at the outset of the week, declining by 1.89% from Sunday.
Forecast for the Bulls:
Reviewing Bitcoin’s technical data points to a generally bullish forecast. Despite facing proximate selling pressure and present-day volatilities, the prevailing longer-term moving averages and overarching market trend are indicators pointing to favorable future prospects.
Segments for Caution:
In contrast, taking a more cautious stance through a bearish lens, the immediate selling indicators revealed by shorter-term moving averages and the downtrend demonstrated in the four-hour charts might foreshadow impending downward price adjustments.
Voice your insights and viewpoints on Bitcoin’s latest market movement in the comments below. What’s your take on the unfolding market dynamics?

Frequently asked Questions
1. How would you define Bitcoin technical analysis?
Bitcoin technical analysis involves analyzing historical price data, volume, and other indicators to understand and predict future price movements of the cryptocurrency. It focuses on studying patterns, trends, and signals within charts to make informed decisions about buying or selling Bitcoin.
2. What does it mean when we say that the rally in Bitcoin’s price has tempered?
When we say that the rally in Bitcoin’s price has tempered, it means that the rapid and significant upward movement in its price has slowed down or stabilized. It is an indication that the buying pressure or momentum behind the cryptocurrency is decreasing, potentially leading to a pause or correction in its price before the next potential surge.
3. How long did the recent 4-week surge of Bitcoin’s price last?
The recent 4-week surge of Bitcoin’s price lasted for a period of four consecutive weeks. During this time, the price of Bitcoin experienced consistent and substantial gains, potentially driven by increased buying interest and market optimism.
4. What factors could have contributed to the easing of bullish momentum in Bitcoin’s price?
Several factors could contribute to the easing of bullish momentum in Bitcoin’s price. These could include profit-taking by investors who have benefited from the recent price surge, increased selling pressure from traders looking to secure their profits, regulatory developments impacting market sentiment, or a general market correction after a prolonged period of upward movement.
5. How does technical analysis help in predicting Bitcoin’s future price movements?
Technical analysis helps in predicting Bitcoin’s future price movements by studying historical price patterns, chart formations, and various technical indicators. These tools enable analysts to identify potential support and resistance levels, trend reversals, and patterns that may suggest future price directions. However, it’s important to note that technical analysis is not foolproof and should be used in conjunction with other forms of analysis and market information.
6. Should investors rely solely on technical analysis for making Bitcoin trading decisions?
Relying solely on technical analysis for making Bitcoin trading decisions may not be advisable. While technical analysis can provide valuable insights into price trends and patterns, it is essential to consider fundamental factors such as news events, market sentiment, and macroeconomic conditions that can significantly impact Bitcoin’s price. A balanced approach, incorporating both technical and fundamental analysis, is often recommended for making informed trading decisions.
7. What precautionary measures can investors take when Bitcoin’s rally tempers?
When Bitcoin’s rally tempers, investors can consider taking precautionary measures to protect their investments. These may include setting stop-loss orders to limit potential losses, diversifying their investment portfolio to include other cryptocurrencies or assets, keeping a close eye on market developments and news, and consulting with trusted financial advisors or experts to gain additional perspectives and guidance.


