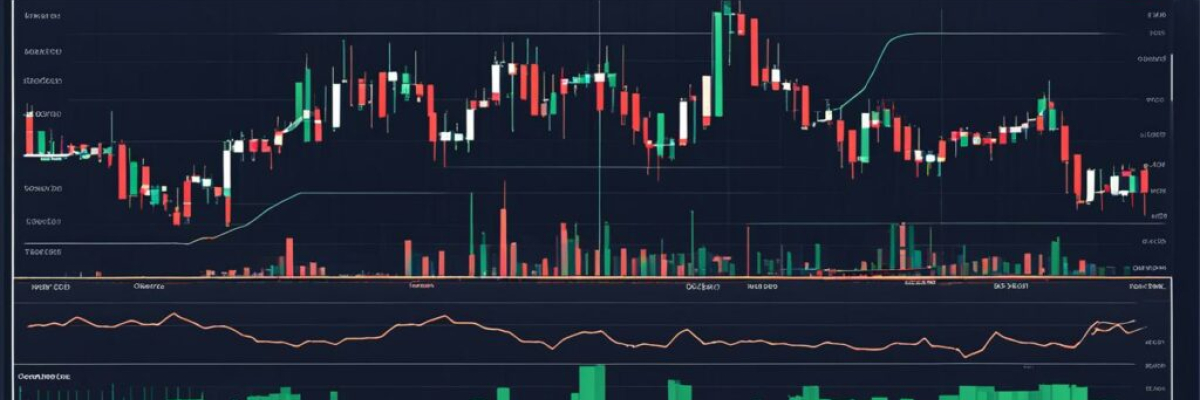
The cryptocurrency world constantly ebbs and flows with the tide of market sentiment, value propositions, and investor behaviors—and Ethereum is no stranger to this dance. We recently witnessed the digital asset dip by 4.7% overnight against the dollar, which further extended to a 6.6% slump over the past week. On a specific day of volatility, November 17, 2023, Ethereum’s market dynamics threw traders into a cautious stance as they navigated through the hazy corridors of crypto trading.
Ethereum’s Market Climate
Ethereum, a heavy hitter in the crypto arena with a robust market capitalization of $236 billion, has shown its resilience time and time again. Within a 24-hour window, Ethereum’s valuation swung from a low of $1,942 to a high of $2,061, painting a picture of a bustling marketplace. The market sentiment, often gauged by the Relative Strength Index (RSI), stood at a neutral 55.4—neither overbought nor oversold. Yet the Moving Average Convergence/Divergence (MACD), known for signaling market momentum changes, tilted towards a bearish forecast with a reading of 75.4.
Delving into the realm of moving averages, both Exponential Moving Averages (EMAs) and Simple Moving Averages (SMAs) spell out a generally optimistic future. The spectrum of values, ranging from $1,720.2 to $1,982, leans heavily towards a bullish sentiment. This pattern builds a compelling narrative of persistent buyer interest over the last week, fostering hope for the trend’s endurance.
Inspecting the nuances of Ethereum’s price movement unveils some key technical levels. The price seems to be cushioned by a critical support zone around $1,950, supporting bullish speculation. On the other hand, a strong resistance hurdle stands firm at $2,139, often rebuffing attempts to surge higher. For market participants considering bullish entry points, the $1,950 mark provides a relatively secure threshold, especially when reinforced by significant market volume.
For those looking to protect their investments and taper down their risk profiles associated with potential downward movements, the wise move includes setting a profit-taking target just below the $2,139 resistance point. Should a bearish pivot occur with prices dropping under the $1,950 support, the short-sellers’ playground emerges, potentially targeting the previous low of $1,520. Here, traders must keep their eyes peeled for heightened trading volume, which could corroborate the bearish turn.
Optimistic Outlook for Ethereum
The convergence of current market indicators and Ethereum’s trading temperament leans towards a bullish prospect. With the moving averages corroborating an uptrend and $1,950 as a reliable floor, the next push in price might just overcome resistance, charting a path for further gains.
A Cautious Warning for Ethereum Traders
Notwithstanding the upbeat signs, a touch of skepticism could be the key to prudent trading. The bearish clues from the MACD combined with the stonewall at the resistance level could culminate in a downward price adjustment. A fall below Ethereum’s stronghold at $1,950 might just spell a bearish reversal waiting to unfold, intensified by sell-off pressures and market volatility.
Opinions and Commentary:
What’s your take on Ethereum’s recent market performance and the possible directions it might head? Eager to hear your thoughts and insights. Feel free to discuss your perspective.

Frequently asked Questions
1. What is Ethereum technical analysis?
Answer: Ethereum technical analysis is a method used to evaluate the price movement and behavior of Ethereum (ETH) by examining historical market data, charts, and patterns. It helps traders make informed decisions based on trends, support and resistance levels, and other technical indicators.
2. How much did Ethereum’s price dip by recently?
Answer: Ethereum’s price recently experienced a dip of 4%, meaning its value decreased by 4% relative to its previous price level. This dip can indicate a potential shift in market sentiment and may affect traders’ strategies.
3. Why are traders cautiously watching the key support level?
Answer: Traders are cautiously watching the key support level because it represents a price level where Ethereum has historically found significant buying interest, preventing further downward movement. If this support level is breached, it could signal a potential downtrend and potentially trigger further selling.
4. What factors contribute to Ethereum’s technical analysis?
Answer: Several factors contribute to Ethereum’s technical analysis, including historical price data, volume patterns, moving averages, chart patterns (such as triangles or head and shoulders), and various technical indicators like the Relative Strength Index (RSI) or Moving Average Convergence Divergence (MACD). These factors help analysts identify potential trends and price reversals.
5. How does technical analysis help traders in their decision-making process?
Answer: Technical analysis provides traders with insights into market sentiment, potential price targets, and entry/exit points. By studying charts and indicators, traders can make more informed decisions about buying or selling Ethereum, manage risk, and develop trading strategies backed by historical patterns and trends.
6. Can technical analysis predict the future price movement of Ethereum?
Answer: While technical analysis can provide valuable insights and help identify potential patterns or trends, it cannot guarantee future price movements. It is important to understand that market dynamics can change rapidly, and external factors like news events or market sentiment can influence Ethereum’s price independently of technical analysis.
7. What are the potential implications of a 4% dip in Ethereum’s price?
Answer: A 4% dip in Ethereum’s price can suggest a short-term bearish sentiment, indicating that more traders are selling than buying. It may lead to increased caution among investors and traders, potentially resulting in a further decline in price if the selling pressure persists. However, it is crucial to consider other technical indicators and factors before drawing definitive conclusions about the market direction.


