“`
Unpacking Bitcoin’s Market Fluctuations and Key Resistance Levels
Between the 16th and 17th of November, 2023, the cryptocurrency flagship, Bitcoin, experienced a notable price movement which saw its value swing from $35,579 up to $37,904, marking a significant span of volatility within 24 hours. As the dust settled, the price of Bitcoin simmered down to $36,387 per BTC. This price stabilization reflects the ever-changing landscape of crypto trade, where such ebbs and flows are commonplace.
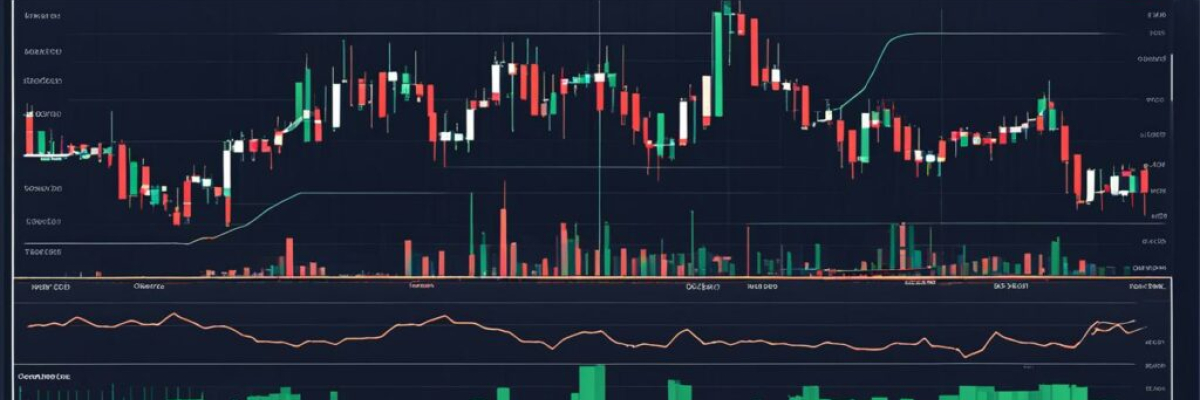
On the 17th of the month, Bitcoin found itself trading around $36,387 following a volatile day. Its Relative Strength Index (RSI), sitting at 60, signals a market that has found some equilibrium for the time being. The market appears to be exhibiting a mix of selling and buying cues based on the assorted readings from the Exponential Moving Average (EMA) and Simple Moving Average (SMA) across several timelines.
Leading up to the aforementioned Friday, Bitcoin seemed to be in the throes of an upward trajectory, hinting at a burgeoning interest from buyers on Thursday. However, when prices soared close to $37,975, the market took a sharp downturn, suggesting the possibility of a corrective action or heralding a reversal in trend. Current market conditions advocate for a cautiously optimistic stance on trading as the weekend approaches.
Strategy and Market Dynamics
Should Bitcoin manage a convincing surge above the recent highs, specifically beyond $36,500, opportunities for initiating long positions could present themselves. It is crucial that such an upward trend is supported by increased trading volume, serving as confirmation. For those looking to execute long trades, it is sensible to consider an exit strategy near the previous high of $37,975, which could act as a resistance territory.
On the flip side, if Bitcoin fails to maintain its upward trajectory above these levels of consolidation, pursuing a short position may be prudent. A target aiming for the last established support around $35,000 would be logical. Although the market’s current sentiment reflects a certain level of assurance in its fortitude, caution is advisable, given the looming potentialities for consolidation or a full reversal. Despite fleeting moments of tranquility, the crypto market is well-known for how quickly it can shift to a state of heightened volatility.
Market Sentiment: Bullish and Bearish Views
Bullish Outlook:
The market activity for Bitcoin on November 17, 2023, despite steep volatility, still skews towards a positive trajectory. The peak value of $37,904 and the closing price, sustained over the crucial level of $36,000, hint at an underlying bullish persistence.
Bearish Perspective:
From a bearish standpoint, the considerable price variations that Bitcoin underwent on November 17, 2023, and its inability to lock in the advance beyond pivotal resistance levels, offer a bit of skepticism. The broad price range seen during the day’s trading and its conclusion below the day’s maximum suggests waning momentum among buyers, signaling caution for potential downward movements.
Thinking about the latest trading conditions for Bitcoin? Feel free to share your insights and analyses in the comments. Understanding the community’s perspective often sheds light on market dynamics and investor sentiment.
“` 
Frequently asked Questions
1. What is Bitcoin technical analysis?
Bitcoin technical analysis is the practice of analyzing historical price and volume data of Bitcoin to predict future price movements. It involves studying charts, patterns, and indicators to make informed trading decisions.
2. How does technical analysis help in understanding Bitcoin’s progress?
Technical analysis helps in understanding Bitcoin’s progress by providing insights into market sentiment, identifying price trends, and predicting potential support and resistance levels. It assists traders and investors in making more informed decisions based on historical patterns and signals.
3. What does the $38K resistance level signify for Bitcoin?
The $38K resistance level signifies a price point at which Bitcoin has historically faced significant selling pressure, making it difficult for the cryptocurrency to surpass that price level. It acts as a psychological barrier, hindering Bitcoin’s progress towards higher price levels.
4. Why is overcoming the $38K resistance level crucial for Bitcoin’s progress?
Overcoming the $38K resistance level is crucial for Bitcoin’s progress as it indicates a potential breakthrough in price, leading to bullish momentum. It suggests that buyers have become stronger, pushing the price higher and potentially opening the door for further upward movement.
5. Are there any factors other than technical analysis that influence Bitcoin’s progress?
Yes, besides technical analysis, various fundamental factors also influence Bitcoin’s progress. These include regulatory developments, market demand, adoption by institutions, macroeconomic conditions, and geopolitical events. Both technical and fundamental analysis should be considered when assessing Bitcoin’s progress.
6. Can the $38K resistance level become a support level once surpassed?
Yes, once the $38K resistance level is surpassed, it can potentially become a support level. In technical analysis, resistance levels often transform into support levels when the price breaks above them. This means that if the price retraces, the $38K level could provide a strong base of buying support.
7. What are the potential implications if Bitcoin fails to overcome the $38K resistance level?
If Bitcoin fails to overcome the $38K resistance level, it could indicate a lack of bullish buying pressure and potentially lead to a price retracement or consolidation. Traders might become cautious, and the price may find support at lower levels, potentially impacting overall market sentiment and Bitcoin’s short-term progress.


